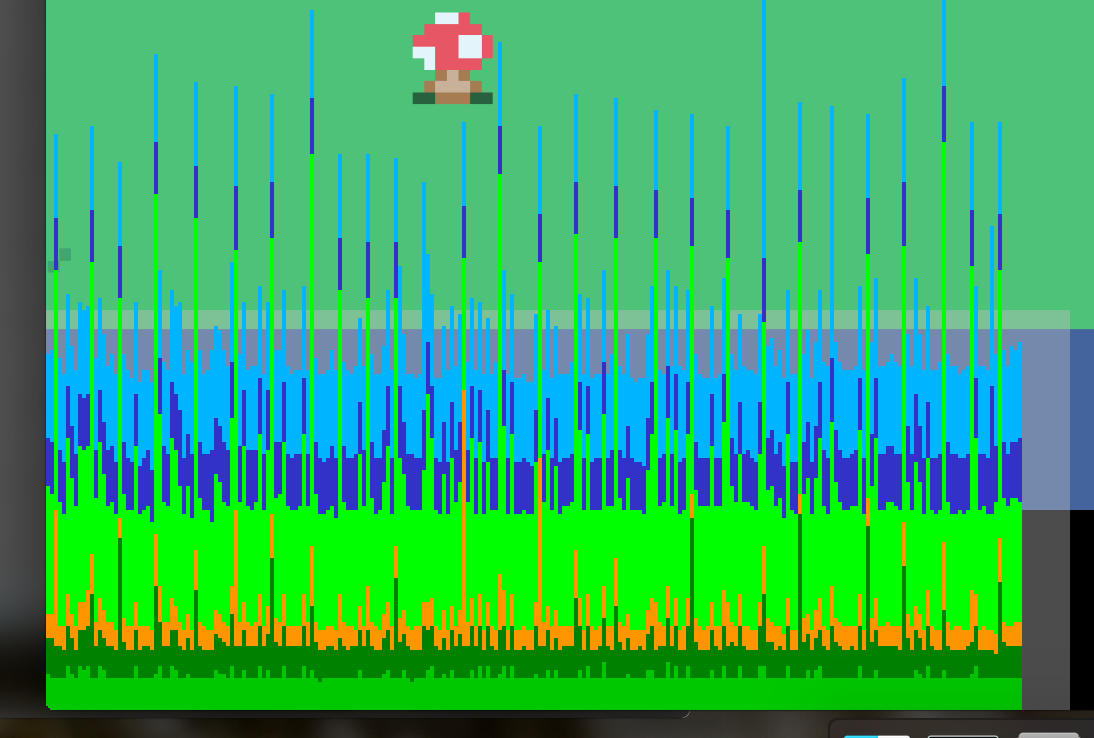
By default, press Shift+` to toggle the graph display, and Shift+1 to toggle relative vs absolute mode. In relative mode, the bottom of the graph is the minimum for that timespan, and the top of the graph is the maximum. In absolute mode, the bottom is 0 and the top is the maximum for that timespan.
Code: Select all
local framerateGraph = {}
framerateGraph.show = false
framerateGraph.showKey = '`'
framerateGraph.showKeyMod = {'lshift', 'rshift'}
framerateGraph.relativeKey = '1'
framerateGraph.relativeKeyMod = {'lshift','rshift'}
framerateGraph.relativeMode = true
framerateGraph.maxSamples = 500
framerateGraph.height = 100

framerateGraph.dtBuffer = {}
framerateGraph.frameMesh = nil

function framerateGraph.load(c0, c1)
	c0, c1 = c0 or {255,255,255,255}, c1 or {100,100,100,255}
	framerateGraph.frameMesh = love.graphics.newMesh({
		{0,0, 0,0, c0[1],c0[2],c0[3],c0[4]},
		{1,0, 0,0, c0[1],c0[2],c0[3],c0[4]},
		{0,1, 0,0, c1[1],c1[2],c1[3],c1[4]},
		{1,1, 0,0, c1[1],c1[2],c1[3],c1[4]}
	}, "strip", "static")
end

function framerateGraph.keypressed(key)
	if key == framerateGraph.showKey and love.keyboard.isDown(unpack(framerateGraph.showKeyMod)) then
		framerateGraph.show = not framerateGraph.show
		return true
	end
	if key == framerateGraph.relativeKey and love.keyboard.isDown(unpack(framerateGraph.relativeKeyMod)) and framerateGraph.show then
		framerateGraph.relativeMode = not framerateGraph.relativeMode
		return true
	end
	return false
end

function framerateGraph.draw()
	table.insert(framerateGraph.dtBuffer, love.timer.getDelta())
	if #framerateGraph.dtBuffer > framerateGraph.maxSamples then
		table.remove(framerateGraph.dtBuffer, 1)
	end

	if framerateGraph.show then
		local dtMax = 0
		local dtMin = math.huge
		local dtAvg = 0
		local dtVariance = 0
		local numSamples = #framerateGraph.dtBuffer
		for i, v in pairs(framerateGraph.dtBuffer) do
			dtMax = math.max(dtMax, v)
			dtMin = math.min(dtMin, v)
			dtAvg = dtAvg + v
		end
		dtAvg = dtAvg / numSamples

		for i, v in pairs(framerateGraph.dtBuffer) do
			dtVariance = dtVariance + ((v - dtAvg) ^ 2)
		end
		dtVariance = dtVariance / numSamples

		local screenWidth = love.graphics.getWidth()
		local graphX = 0
		local graphY = 6
		local graphWidth = screenWidth - 100
		local barSpacing = graphWidth / numSamples
		local barWidth = barSpacing
		local graphHeight = framerateGraph.height

		for i, v in pairs(framerateGraph.dtBuffer) do
			local h = (v / dtMax) * graphHeight
			if framerateGraph.relativeMode then
				h = ((v - dtMin) / (dtMax - dtMin)) * graphHeight
			end
			local x = graphX + ((i - 1) * barSpacing)
			local y = graphY + graphHeight - h

			love.graphics.setColor(255, 255, 255, 255)
			love.graphics.draw(framerateGraph.frameMesh, x, y, 0, barWidth, h)
		end
		love.graphics.print(string.format("%.2f ms max", dtMax * 1000), graphX + graphWidth + 6, graphY - 6)
		love.graphics.print(string.format("%.2f ms min", dtMin * 1000), graphX + graphWidth + 6, graphY + graphHeight - 6)

		love.graphics.setColor(50, 220, 50, 255)
		love.graphics.line(graphX, graphY + graphHeight, graphX + graphWidth, graphY + graphHeight)

		local x = graphX
		for i = 1, 20 do
			love.graphics.line(x, graphY, x + (graphWidth / 40), graphY)
			x = x + (graphWidth / 20)
		end

		local avgHeight = (dtAvg / dtMax) * graphHeight
		if framerateGraph.relativeMode then
			avgHeight = (((dtAvg - dtMin) / (dtMax - dtMin)) * graphHeight)
		end
		local avgLineY = graphY + graphHeight - avgHeight

		love.graphics.setColor(220, 150, 10, 255)
		love.graphics.line(graphX, avgLineY, graphX + graphWidth, avgLineY)
		love.graphics.print(string.format("%.2f ms avg", dtAvg * 1000), graphX + graphWidth + 6, avgLineY - 6)

		if dtVariance * 1000 > 0.1 then
			love.graphics.setColor(255, 50, 50, 255)
		else
			love.graphics.setColor(200, 200, 200, 255)
		end
		love.graphics.print(string.format("%.2f ms std. dev.", dtVariance * 1000), graphX + 6, graphY + graphHeight + 2)

		love.graphics.setColor(255, 255, 255, 255)
	end
end


return framerateGraphCode: Select all
local framerateGraph = require("framerateGraph")

function love.load()
    framerateGraph.load()
    --your stuff here
end

function love.draw()
    framerateGraph.draw()
end

function love.keypressed(key, ...)
    if framerateGraph.keypressed(key) then
        return
    end
    --your stuff here; framerateGraph will only eat input if it's a key that is relevant to it so make sure you put your own code AFTER that
end