Execution speed varies wildly (47x) between (but not during) runs

Questions about the LÖVE API, installing LÖVE and other support related questions go here.
Forum rules
Before you make a thread asking for help, read this.
nameless tee
Prole
Posts: 15
Joined: Mon Apr 22, 2019 8:16 am

Execution speed varies wildly (47x) between (but not during) runs

Post by nameless tee »

Hello,

I'll start with some background info:

driven by curiosity I've been working on a small FPS without external libraries. I've got a first prototype working (video on imgur) with all the linear algebra stuff written in plain lua. Although it's running fine on a desktop PC (~25% of one core) with an extremely simple map I thought it should be possible to improve on this.

So now I'm trying to write a faster linear algebra library using the FFI and metaprogramming.

I'm hoping that using the FFI will help reduce overhead from using tables and that it will help the JIT work it's magic. Also some algorithms (for example the Expanding Polytope Algorithm) use data structures that could be allocated in advance.

Metaprogramming should be useful because the linear algebra library needs a lot of very similar functions, for example adding/subtracting vectors/matrices of different sizes. If I wrote all that by hand it would take ages and it would become very difficult to change anything due to duplication. If I used plain Lua instead but with a style similar to metaprogramming it would cause additional overhead and having the same functions handle different types/numbers of iterations might prevent LuaJIT from compiling those.

The actual issue:

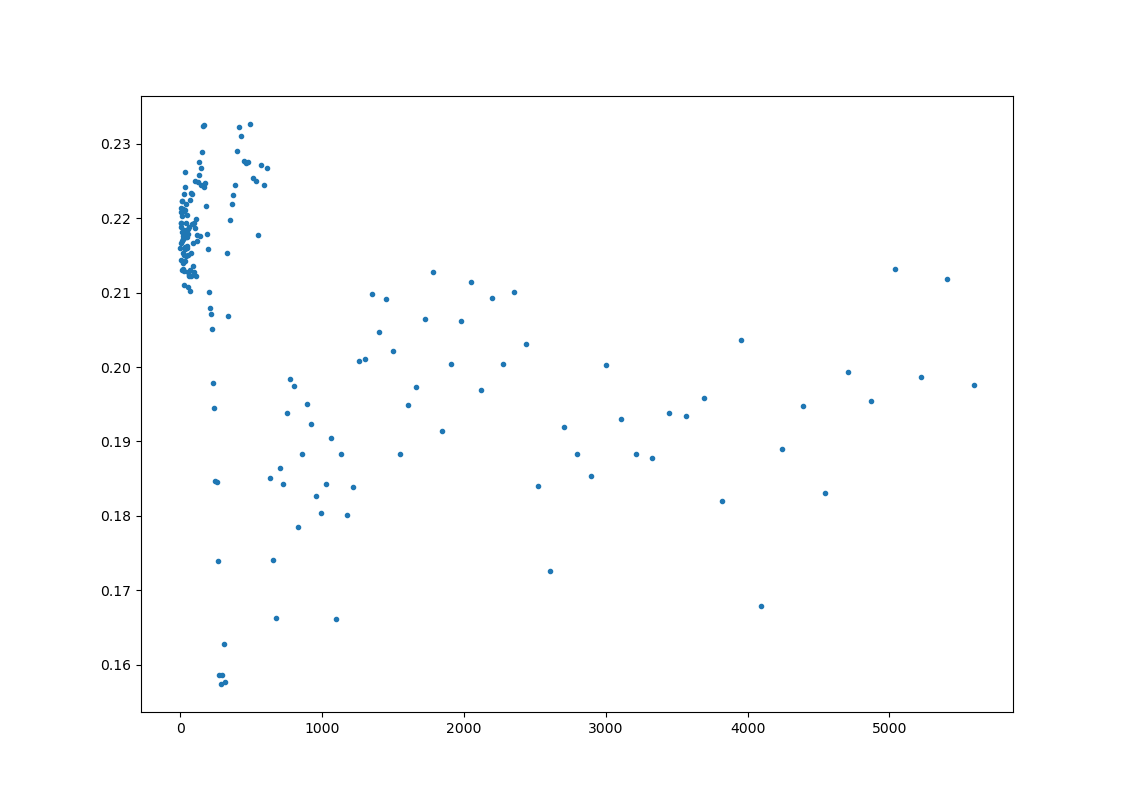
Now that the linear algebra library is working, I made a very simple benchmark that creates a bunch of random vectors, adds some of them together in nonsensical ways and sums the l2-norms of some of the results.

Unfortunately the performance is extremely inconsistent between runs. Sometimes the part the test measures takes ~0.005s or ~0.01s, but most of the time it takes ~0.25s, which is painfully slow. What is even weirder is that the time appears to be constant during each run. The timing doesn't change even if it's running for minutes.

Adding to the weirdness, modifying code that isn't running in the benchmark loop or even code that is completely dead appears to change the likelihood of getting a fast run. For example removing some of the unused metamethods of the vector type led to 7% higher likelihood of fast runs. Ignoring the result of the preprocessor and just loading the vector type from a pre-made file does not change the result. But removing the preprocessor completely and just using it's previous output "disables" the sub-0.25s case completely.


What the program consists of:

While this example is hardly minimal, I wasn't able to remove more and still get high-performing runs.
  • main.lua Small benchmark
  • preprocessor.lua Tiny preprocessor used for processing templates
  • la2.lua Linear algebra. Uses preprocessor to lazily create vector metatypes.
  • hateful.lua The benchmark but without love (and without precise timing). Is always slow for some reason.
  • templates/vec.lua Template for creating vector metatypes.
  • templates/vecmeta.lua Template for creating vector metatables.
  • test_PrePro_debug.lua Output of the preprocessor for vec4.
  • stuff/* Some boring utilities.
How to run the program:

To be able to run with and without love, the preprocessor uses io.open for loading templates, so it probably won't run as a .love file. Instead unzip the files and start "love ." from inside the folder.

If you're on Linux you can use statistics.py to run the program 100 times. It outputs the total time for every run to stdout as a list.

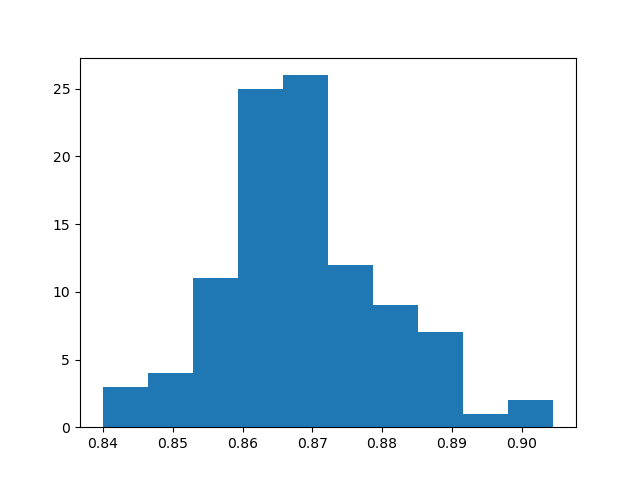
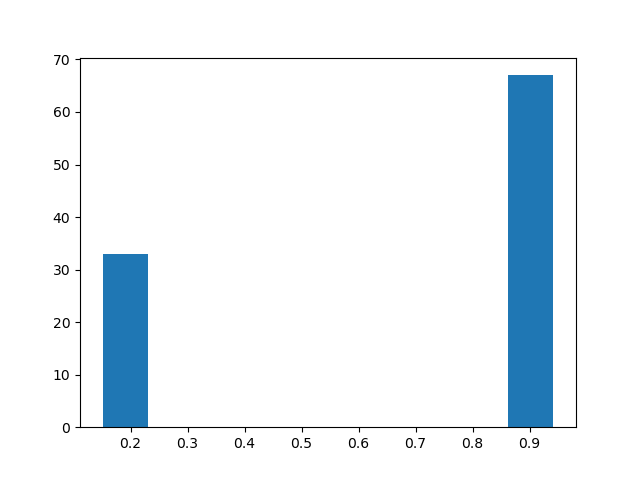
Probability distributions:

These histograms show the distribution of total runtime (including starting and stopping love) under various conditions. 100 samples each.
  • The preprocessor is not loaded at all. Instead previous output of the preprocessor is loaded via require.
    Image
  • The preprocessor is enabled but it's output is discarded. Instead previous output of the preprocessor is loaded via require. The preprocessor does not directly interact with the code in the benchmark at all.
    Image
  • More results on imgur
Questions:
  • Why is performance varying this wildly? Why does changing seemingly unrelated things completely change the distribution?
  • What can be done to get this working reliably? Are there possible workarounds?
  • What tools are there to investigate?
  • Are there any other things I could be doing better?
  • Are there potential problems with using union?
  • Why is performance consistently poor when I run it directly with LuaJIT instead of using Löve?
  • Are there other places on the internet more suited to this question?
If you read until here, thank you for your patience. If you have an idea but lack the time to dig deeper, please don't hesitate to ask me to do it.

Edit: There was a sentence I forgot to finish.
Attachments
test.zip
(11.76 KiB) Downloaded 161 times
User avatar
ReFreezed
Party member
Posts: 612
Joined: Sun Oct 25, 2015 11:32 pm
Location: Sweden
Contact:

Re: Execution speed varies wildly (47x) between (but not during) runs

Post by ReFreezed »

I tested it and I seem to get similar inconsistency between different runs. Sometimes the test takes 0.008 seconds every time, sometimes they take 0.120 every time.

I'm not sure this information will help with your situation in any way, and it may have nothing to do with the inconsistency, but in my experience it doesn't make much difference between using tables to represent vectors or using FFI/C structs (as the latter requires allocations of userdata objects constantly). I did create a vector math library at one point that represented vectors as tables and that was slow, so I converted it to use C structs instead and it made no difference in my tests. In the end, my vector math now only uses normal Lua numbers instead - no tables or C data anywhere, like so:

Code: Select all

function vector3Add(x1,y1,z1, x2,y2,z2)
	return x1+x2, y1+y2, z1+z2
end
It's super straightforward and seems to be the fastest (at least in my use cases). I think many kinds of interactions between C and Lua are going to be relatively slow, so it's probably best to have most math code in either C or Lua.
Tools: Hot Particles, LuaPreprocess, InputField, (more) Games: Momento Temporis
"If each mistake being made is a new one, then progress is being made."
grump
Party member
Posts: 947
Joined: Sat Jul 22, 2017 7:43 pm

Re: Execution speed varies wildly (47x) between (but not during) runs

Post by grump »

I tested it too, and can confirm the observations. Simplifying the example code more would go a long way towards getting better answers here. I'd suggest removing complexity step by step until you find the culprit. Search the forums for "profiler", ivan released a lib that might be helpful here.
ReFreezed wrote: Mon Jan 06, 2020 1:43 pm it doesn't make much difference between using tables to represent vectors or using FFI/C structs
That's true in my experience; structs can even turn out to be marginally slower in many scenarios, although they have a smaller memory footprint.
User avatar
pgimeno
Party member
Posts: 3548
Joined: Sun Oct 18, 2015 2:58 pm

Re: Execution speed varies wildly (47x) between (but not during) runs

Post by pgimeno »

I picked up hateful.lua and ran luajit -j dump on it. It said it was aborting the trace in ffi.new, so I moved N and ffi.new out of the loop and now hateful.lua always runs at full speed. Strangely enough, in LuaJIT 2.1-beta3 it still runs slow; the strange thing is that it's not saying that the trace is aborted.

Code: Select all

$ diff -u hateful.lua.orig hateful.lua
--- hateful.lua.orig	2020-01-06 00:25:46.000000000 +0100
+++ hateful.lua	2020-01-06 17:04:19.162244251 +0100
@@ -12,9 +12,10 @@
 local vec4 = la2.vec4
 --~ local vec4 = require("test_PrePro_debug")()
 
+local N = 1000
+local vs = ffi.new("struct vec4[?]", N)
+
 local function test2()
-	local N = 1000
-	local vs = ffi.new("struct vec4[?]", N)
 	for i = 0, N-1 do
 		for j = 0, 3 do
 			vs[i].arr[j] = math.random()
I fail to understand why LuaJIT doesn't restart tracing after the instruction that broke the trace, but then again, I barely know anything about how LuaJIT works.

My understanding is that "tracing" is something that LuaJIT does when it detects code that is often executed, and that the purpose is to detect patterns that it can compile to IR and then to machine code. If it detects something that prevents compilation, the trace is aborted.

I don't know if it's possible to run the dump within LÖVE.
User avatar
slime
Solid Snayke
Posts: 3132
Joined: Mon Aug 23, 2010 6:45 am
Location: Nova Scotia, Canada
Contact:

Re: Execution speed varies wildly (47x) between (but not during) runs

Post by slime »

I wonder if tweaking LuaJIT's optimization parameters (near the bottom of http://luajit.org/running.html ) would make it JIT compile the code more consistently. If you use LÖVE instead of the standalone LuaJIT interpreter you can use jit.opt.start to control them: http://luajit.org/ext_jit.html#jit_opt

OpenResty's fork of LuaJIT has some tweaks to the values of the defaults, maybe those tweaks would be a good thing to test first: https://github.com/openresty/luajit2#up ... parameters


EDIT: I think stripping out all the boilerplate generic code until performance is consistently good is probably a good idea, at the very least it will help you figure out what's causing the performance drop.
User avatar
raidho36
Party member
Posts: 2063
Joined: Mon Jun 17, 2013 12:00 pm

Re: Execution speed varies wildly (47x) between (but not during) runs

Post by raidho36 »

You're doing too few runs. Increase number of iterations until it takes more than a minute to execute. If a very rough ballpark estimate numbers are acceptable, a several seconds long run would suffice. That said, in your particular scenario this just scales the amount of time, it runs either fast or extremely slowly.

As for math library, geometrical operations between dimensions are totally incompatible so you might as well write entirely separate libraries.
Last edited by raidho36 on Tue Jan 07, 2020 3:01 am, edited 2 times in total.
nameless tee
Prole
Posts: 15
Joined: Mon Apr 22, 2019 8:16 am

Re: Execution speed varies wildly (47x) between (but not during) runs

Post by nameless tee »

Thanks to all of you for reproducing the problem and having a look at it!

ReFreezed: It seems to me that for my use case the multiple arguments/returns solution is not a good match. It doesn't solve the problem of efficiently allocating large data structures containing many vecs/matrices/whatever and it doesn't help much with writing code either as types get larger (like matrices).

grump: AFAIK ivans profiler uses Luas debug.* functions, which causes a lot of overhead and messes with LuaJITs behaviour, so it won't help much with this problem.

pgimeno: After reading your post I tried to understand the output of luajit -jdump and luajit -jv but without much success. To my surprise your patch does not appear to speed anything up on my machine. I tried it with both LuaJIT 2.0.5 and LuaJIT 2.1 compiled from the git repository (it's amazing that a project like LuaJIT compiles without dependencies or other hiccups!).

The -jdump idea led me down the rabbit hole of trying other options like -jv and the sampling profiler that comes with 2.1. I used it with the simplified code that is attached to this post.

slime: I did play around with jit.opt.start and also tried setting some of the optimization parameters mentioned in http://luajit.org/running.html but did not notice any obvious changes. Judging the effect of these kind of changes is tricky, though. For example when I added jit.opt.start in one of the main.luas I experimented with (I'm starting to loose track of the variations I've tried) the likelihood of fast runs went up, but when I replaced the lines with function calls that do effectively nothing (collectgarbage("count")) the results were just as good.

Smaller example:

I've attached a smaller example that demonstrates the issue. This time it's a love file that can actually be run directly.
  • The main.lua contains not only the "benchmark" but also a loop that generates a bunch of seemingly useless functions. I included this to simulate the effect the preprocessor might have had in the previous example. When the useless-function-generator is not included, performance is consistently bad.
  • The main_nolove.lua is a variation of the main.lua that can run without love. It can also run with love, but just adding the without-love functionality significantly changed the likelihood of getting a fast run, so it has to be in a separate file.
  • vec.lua contains a simple definition of a vector type with two methods.
  • statistics.py is optional and requires python3 and matplotlib. The extracted test_small.love must be the working directory. It rewrites the main.lua to use different (exponentially spaced) numbers for the iteration count of the seemingly-useless-function-generator and records the average timing of the "benchmark".
  • statistics.json contains the results generated from letting this run for a day.
Correlation between number of useless functions and average time

This is maybe not very helpful, but I wanted to confirm my suspicion that changing even tiny seemingly unrelated things in the code affects the results.

Image

x is number of iterations in the useless-function-generator, y is the average time for one "benchmark" step. > 300 samples for each point.

Sampling profiler results and possible workaround:

Here are the results of LuaJIT2.1s sampling profile (one sample per millisecond, absolute values)r:

Code: Select all

$ ~/repos/luajit-2.0/src/luajit -jp=ai1r main_nolove.lua # This is 2.1 even though the path says 2.0.
====== ./vec.lua ======
@@ 1 @@
      | local vec4
      | local meta = {}
      | function meta.aadd(a, b)
   16 | 	for i = 0, 3 do
    4 | 		a.arr[i] = a.arr[i] + b.arr[i]
      | 	end
   41 | 	return a
      | end
      | function meta.l2(a)
      | 	local sum = 0

====== main_nolove.lua ======
@@ 28 @@
      | 	end
      | 	for i = 0, N-1 do
      | 		for j = i+1, N-1 do
   21 | 			vs[i]:aadd(vs[j])
      | 		end
      | 		sum = sum + vs[i]:l2()
      | 	end
Apparently LuaJIT really hates loops longer than two that use ctypes. I don't really know how much of the code each bin of the profiler covers. The high sample counts for calling aadd and returning from there suggests that just calling and exiting the function is extremely costly. Also the sample count on the loop itself seems unreasonably high.

If I shorten the loop in aadd to 2, suddenly all of the sluggishness vanishes:

Code: Select all

====== ./vec.lua ======
@@ 1 @@
      | local vec4
      | local meta = {}
      | function meta.aadd(a, b)
    1 | 	for i = 0, 1 do
      | 		a.arr[i] = a.arr[i] + b.arr[i]
      | 	end
      | 	--~ a.arr[0] = a.arr[0] + b.arr[0]

====== main_nolove.lua ======
@@ 28 @@
      | 	end
      | 	for i = 0, N-1 do
      | 		for j = i+1, N-1 do
    1 | 			vs[i]:aadd(vs[j])
      | 		end
      | 		sum = sum + vs[i]:l2()
      | 	end
What does seem to work is just "unrolling" the loop by hand:

Code: Select all

====== ./vec.lua ======
@@ 2 @@
      | local meta = {}
      | function meta.aadd(a, b)
      | 	a.arr[0] = a.arr[0] + b.arr[0]
    1 | 	a.arr[1] = a.arr[1] + b.arr[1]
      | 	a.arr[2] = a.arr[2] + b.arr[2]
      | 	a.arr[3] = a.arr[3] + b.arr[3]
      | 	return a

====== main_nolove.lua ======
@@ 28 @@
      | 	end
      | 	for i = 0, N-1 do
      | 		for j = i+1, N-1 do
    1 | 			vs[i]:aadd(vs[j])
      | 		end
      | 		sum = sum + vs[i]:l2()
      | 	end
 
It's not a pretty solution and I don't know if it's reliable or how if it scales well. It is also not applicable when random access to a ctype is needed, but maybe it's good enough for my project. I'm still interested as to why the slowdown happens, though, so please don't close the topic and if you have any ideas, please let me know!

Oh, and somewhat off-topic: It would be nice if Löve2D included the fancy profiler.

Edit: I accidentally uploaded the wrong file. Now it should be the correct version.
Attachments
test_smaller.love
Whoops, I uploaded the wrong file. This time it should be correct.
(228.26 KiB) Downloaded 138 times
Last edited by nameless tee on Tue Jan 07, 2020 3:14 am, edited 2 times in total.
User avatar
raidho36
Party member
Posts: 2063
Joined: Mon Jun 17, 2013 12:00 pm

Re: Execution speed varies wildly (47x) between (but not during) runs

Post by raidho36 »

I tried running your code with my own vec4 library and it runs consistently. The problem seems to be in abusing the trace compiler. You might be able to get good results by fiddling around with JIT compilation settings. Then again I suggest implementing it properly instead of screwing around with both the code and the compiler.
Attachments
vec4.lua
(9.81 KiB) Downloaded 141 times
MrFariator
Party member
Posts: 511
Joined: Wed Oct 05, 2016 11:53 am

Re: Execution speed varies wildly (47x) between (but not during) runs

Post by MrFariator »

In relation to pgimeno's post, and what slime suggested, it might be worth trying to increase the optimization parameters. I remember someone doing an emulator or something that sort, and having this little passage helped with reducing luajit traces (increase values as necessary, if it helps):

Code: Select all

if pcall(require, "jit.opt") then
  require("jit.opt").start(
    "maxmcode=8192",
    "maxtrace=8192"
  )
end
edit: Oops, I clearly did not read your posts well enough, and missed you claim you had tried this already.
User avatar
slime
Solid Snayke
Posts: 3132
Joined: Mon Aug 23, 2010 6:45 am
Location: Nova Scotia, Canada
Contact:

Re: Execution speed varies wildly (47x) between (but not during) runs

Post by slime »

nameless tee wrote: Tue Jan 07, 2020 2:58 am Oh, and somewhat off-topic: It would be nice if Löve2D included the fancy profiler.
LÖVE will use LuaJIT 2.1 - including its profiler APIs - on all platforms in the next major version (12.0), now that it's more stable. :)
Post Reply

Who is online

Users browsing this forum: No registered users and 96 guests